File:Graid-performance.png
(add raw data) |
|||
| Line 2: | Line 2: | ||
'''System: ''' | '''System: ''' | ||
| − | amd64 6.2-RELEASE | + | amd64 FreeBSD 6.2-RELEASE |
| + | amd64 Ubuntu Server 7.04 | ||
| + | |||
| + | Athlon X2 5000+, 2GB RAM | ||
3x Western Digital 250GB drives (WDC WD2500JS-22NCB1 10.02E02 SATA-300) | 3x Western Digital 250GB drives (WDC WD2500JS-22NCB1 10.02E02 SATA-300) | ||
2x Western Digital 500GB drives (WDC WD5000AAKS-00YGA0 12.01C02) | 2x Western Digital 500GB drives (WDC WD5000AAKS-00YGA0 12.01C02) | ||
| Line 10: | Line 13: | ||
(using dd if=/dev/random bs=16m count=200). | (using dd if=/dev/random bs=16m count=200). | ||
| − | For these tests, read-ahead cache value was GREATLY increased from 6.2-RELEASE's default of 8: '''sysctl -w vfs.read_max=128'''. | + | For these tests, read-ahead cache value was GREATLY increased from 6.2-RELEASE's default of 8: '''sysctl -w vfs.read_max=128'''. Linux's read-ahead cache value was similarly greatly increased from 256 to 4192 using '''hdparm /dev/md0 -a4192'''. |
| − | + | The "-r" option (use parity drive on reads) for graid3 was also tested but typically resulted in slight to severe performance decrease, so was not included on the graph, although its raw data is available below. | |
| − | The "-r" option (use parity drive on reads) for graid3 was also tested but typically resulted in slight to severe performance decrease, so was not included on the graph. | + | |
Raw data follows: | Raw data follows: | ||
| + | Nvidia onboard RAID0+1: 3x250/1x500 97 142 160 151 144 * 7s delta on 2-process copy... 66 second delta on 5-process copy | ||
Graid3: 3x250/2x500 213 137 106 105 105 | Graid3: 3x250/2x500 213 137 106 105 105 | ||
Graid3: 3x250/2x500 -r 187 144 103 105 107 | Graid3: 3x250/2x500 -r 187 144 103 105 107 | ||
| + | Graid3: 3x250 115 98 77 76 75 | ||
| + | Graid3: 3x250 -r 116 88 79 76 75 | ||
| + | Linux RAID1: 2x250 62 114 108 102 110 * 31s delta on 4-copy... 30-sec delta on 5-copy | ||
Nvidia onboard RAID1: 2x250 60 108 90 96 100 * 15 secs delta on 2-process copy / 38 seconds on 5-process! | Nvidia onboard RAID1: 2x250 60 108 90 96 100 * 15 secs delta on 2-process copy / 38 seconds on 5-process! | ||
| − | |||
| − | |||
Baseline: 1x500 76 70 72 72 72 | Baseline: 1x500 76 70 72 72 72 | ||
Gmirror: 3x250/2x500 round-robin 63 73 69 71 72 | Gmirror: 3x250/2x500 round-robin 63 73 69 71 72 | ||
Revision as of 00:35, 28 December 2007
Chart showing performance of graid3 and gmirror (and some proprietary RAID1 hardware implementations).
System:
   amd64 FreeBSD 6.2-RELEASE
   amd64 Ubuntu Server 7.04

   Athlon X2 5000+, 2GB RAM
   3x Western Digital 250GB drives (WDC WD2500JS-22NCB1 10.02E02 SATA-300)
   2x Western Digital 500GB drives (WDC WD5000AAKS-00YGA0 12.01C02)
   Nvidia nForce onboard RAID controller, Promise TX2300 RAID controller
Each process shown in the graph is a cp to /dev/null of an individually generated 3200MB random binary file (using dd if=/dev/random bs=16m count=200).
For these tests, read-ahead cache value was GREATLY increased from 6.2-RELEASE's default of 8: sysctl -w vfs.read_max=128. Linux's read-ahead cache value was similarly greatly increased from 256 to 4192 using hdparm /dev/md0 -a4192.
The "-r" option (use parity drive on reads) for graid3 was also tested but typically resulted in slight to severe performance decrease, so was not included on the graph, although its raw data is available below.
Raw data follows:
Nvidia onboard RAID0+1: 3x250/1x500	97	142	160	151	144	* 7s delta on 2-process copy... 66 second delta on 5-process copy
Graid3: 3x250/2x500			213	137	106	105	105
Graid3: 3x250/2x500 -r			187	144	103	105	107
Graid3: 3x250				115	98	77	76	75
Graid3: 3x250 -r			116	88	79	76	75
Linux RAID1: 2x250			62	114	108	102	110	* 31s delta on 4-copy... 30-sec delta on 5-copy
Nvidia onboard RAID1: 2x250		60	108	90	96	100	* 15 secs delta on 2-process copy / 38 seconds on 5-process!
Baseline: 1x500			76	70	72	72	72
Gmirror: 3x250/2x500 round-robin	63	73	69	71	72
Promise TX-2300 RAID1: 2x250		61	52	54	55	57	* 15 sec delta on 5-process copy
Gmirror: 3x250 round-robin		59	53	53	56	55
Gmirror: 2x250 round-robin		58	49	51	51	50
Baseline: 1x250			56	56	55	55	56
Gmirror: 3x250 split 128k		55	46	49	55	54
Gmirror: 2x250 split 128k		55	47	47	47	48
Gmirror: 3x250/2x500 split 128k	54	50	47	47	47
"Delta" in raw numbers refers to individual processes finishing significantly faster than others, though all were started simultaneously.
File history
Click on a date/time to view the file as it appeared at that time.
| Date/Time | Thumbnail | Dimensions | User | Comment | |
|---|---|---|---|---|---|
| current | 04:28, 29 December 2007 | 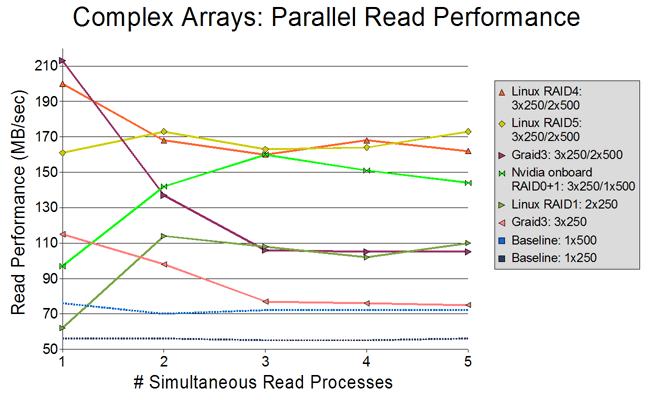 | 650 × 400 (25 KB) | Jimbo (Talk | contribs) | |
| 03:54, 29 December 2007 | No thumbnail | (25 KB) | Jimbo (Talk | contribs) | (add Linux RAID4 data) | |
| 02:13, 28 December 2007 | 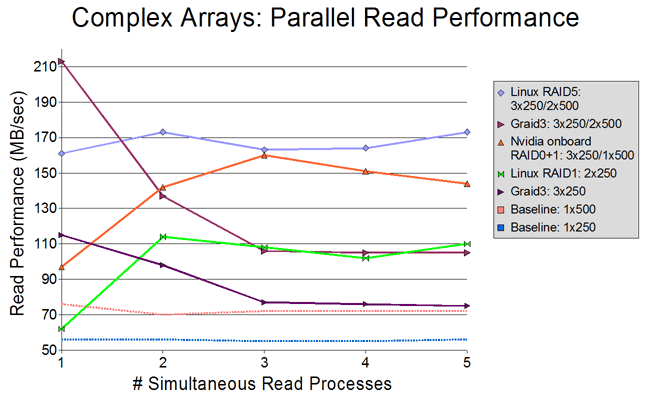 | 650 × 400 (22 KB) | Jimbo (Talk | contribs) | (Linux RAID5 data added) | |
| 00:30, 28 December 2007 | 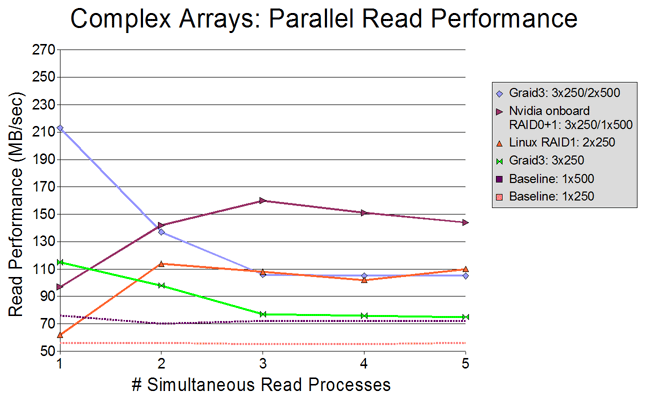 | 650 × 400 (21 KB) | Jimbo (Talk | contribs) | (added some linux and nvidia 0+1 data) | |
| 22:00, 26 December 2007 | 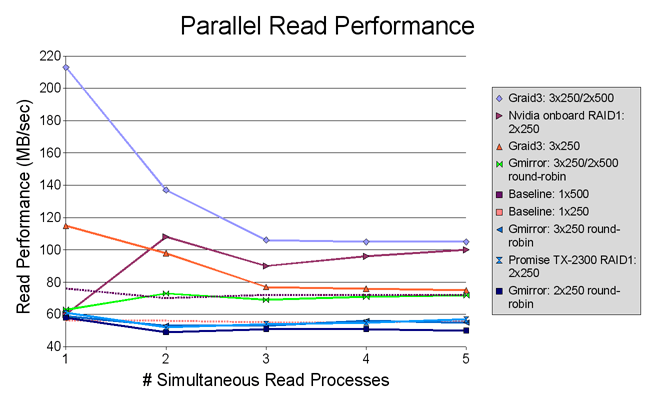 | 650 × 400 (22 KB) | Jimbo (Talk | contribs) |
- Edit this file using an external application (See the setup instructions for more information)
File usage
The following page links to this file: